Five numbers
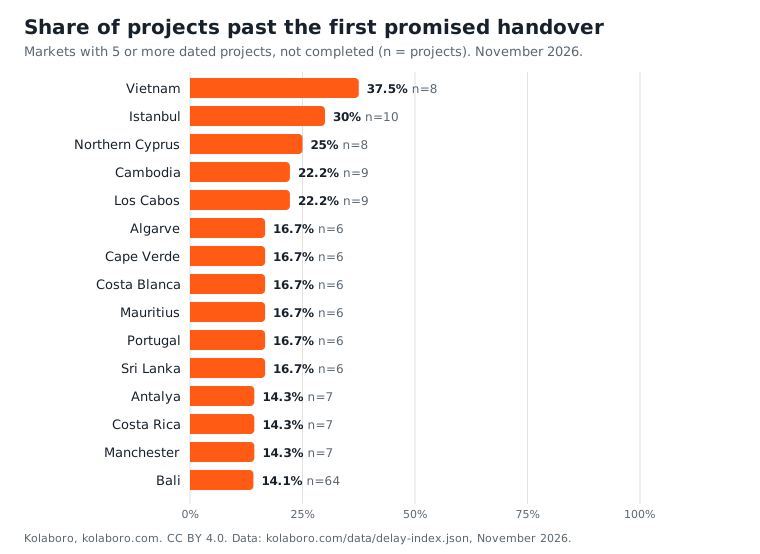
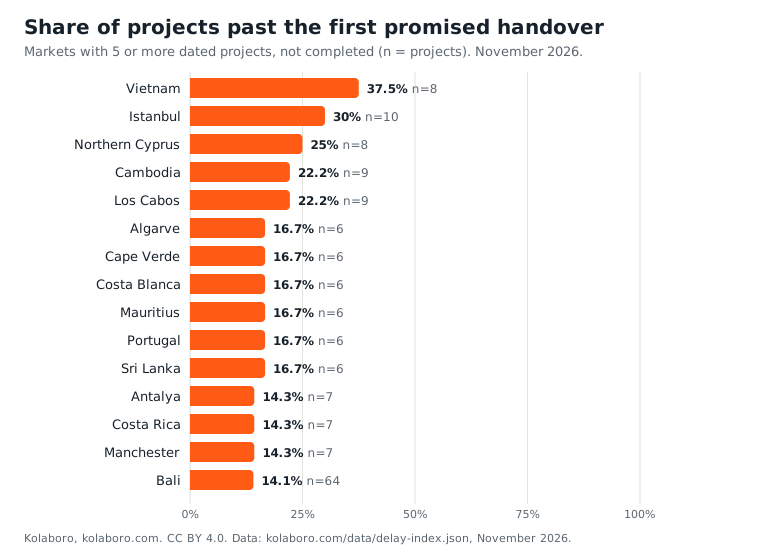
- 8.2%8.2% of tracked off-plan projects with a usable handover date (62 of 755) are past the first handover date on record.Source: /index/delays/ and /data/delay-index.json
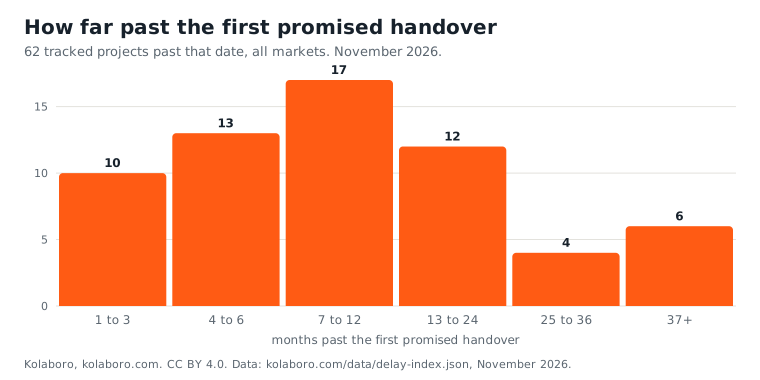
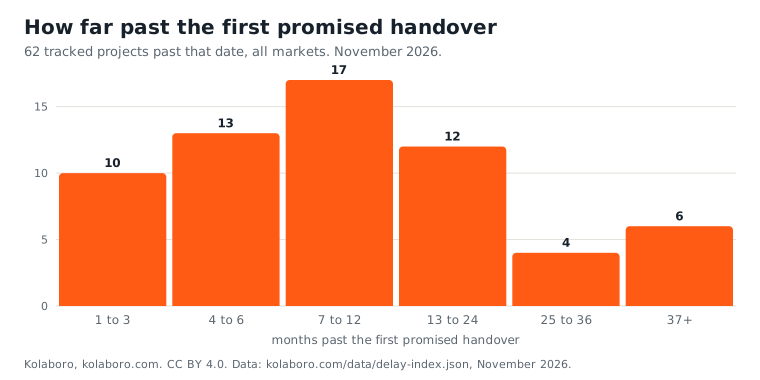
- 10.5 monthsMedian time past the first handover date among those 62 projects: 10.5 months (90th percentile: 35 months).Source: /index/delays/ and /data/delay-index.json
- 4.1%4.1% (31 of 755) are past the handover date their sellers advertise today.Source: /index/delays/ and /data/bali-cases.json
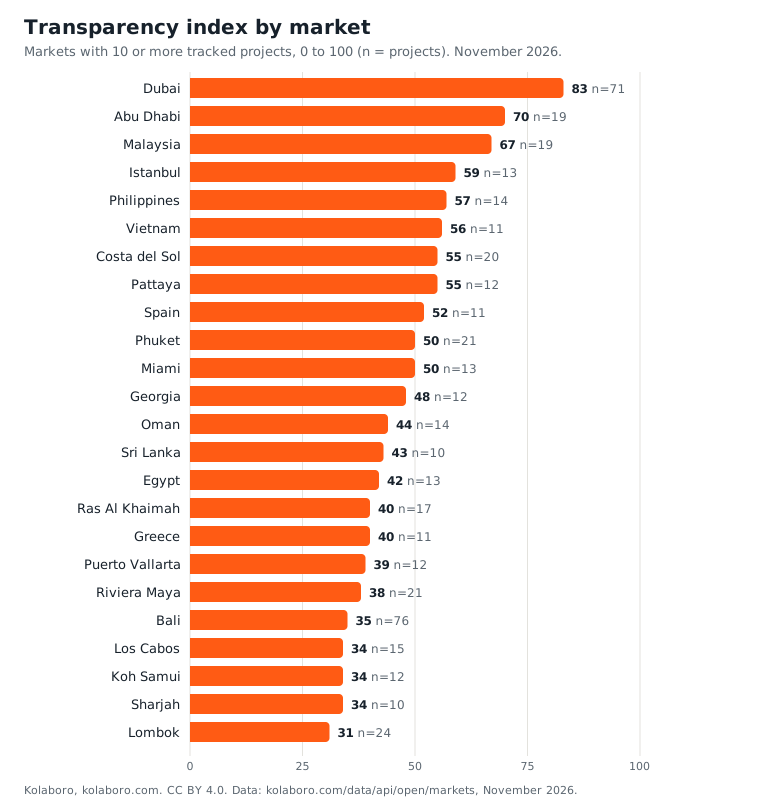
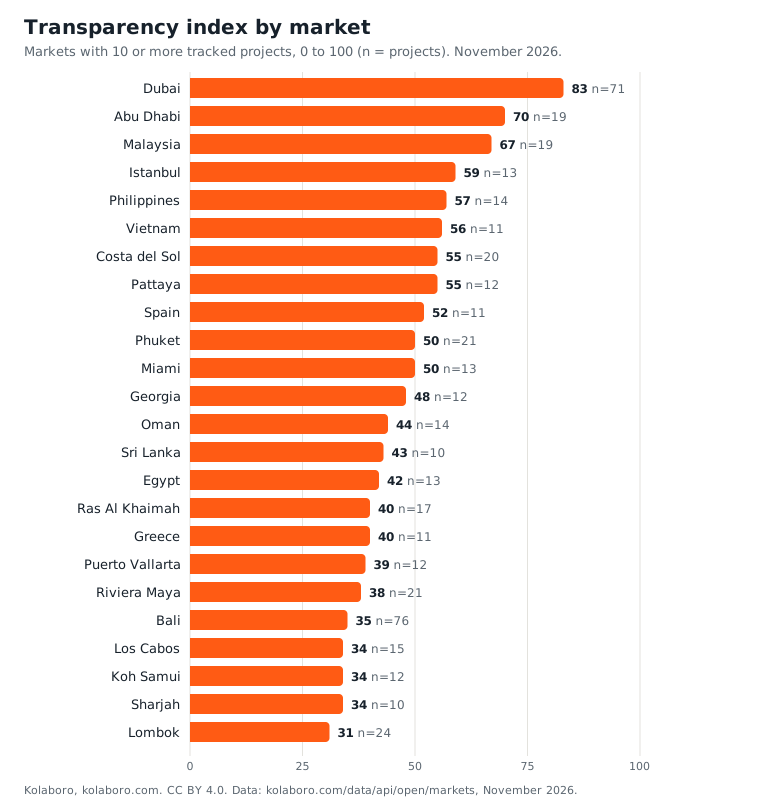
- 42 of 100Median transparency index across 95 markets with 3 or more tracked projects: 42 out of 100.Source: /transparency-index/ and /api/open/markets
- 100.03Advertised asking-price index, all tracked markets: 100.03 on 2026-11-03 (base 100 on 2026-10-28, same-project pairs only).Source: /index/prices/ and /data/price-index.json
Summary
Kolaboro data show 896 tracked projects across 144 markets in November 2026. Of these, 755 projects have a handover date that can be used for the delay index. History for the delay index starts this month. Among those 755 projects, 62 are past the first handover date, a share of 8.2%, and 31 are past the current advertised handover date, a share of 4.1%. For projects past the first handover date, the median is 10.5 months and the 90th percentile is 35.0 months. In 50 markets, at least 5 projects have a handover date. The transparency index covers 95 markets, with a median of 42.0 on a scale with a maximum of 100. The price index for all markets stands at 100.03, against a base of 100.
Drafted by an AI model (claude-sonnet-5-5) from the numbers above, then checked by code: every number in it appears in the data.
Charts you may reuse
Inputs
- /data/bali-cases.json
sha256 b43b17f35cef73dd - /data/price-index.json
sha256 4ce4d49efcfdd774
Earlier months
This is the first monthly release. A new one is generated on the first run of each month.
How this release is made
A scheduled job on our build system reads the open files at the start of each month: the delivery-delay index, the asking-price index and the per-market transparency index (recomputed from the project file with the published formula). It picks the five numbers above with fixed rules, draws the charts and writes the plain text and JSON versions.
An AI model (Claude) may draft the summary paragraph from those numbers only. Code then checks the draft: every number in it must appear in the data, spelled-out numbers, dashes and loaded words such as "soaring" or "crisis" are refused, and if anything fails the check the release uses a fixed template filled from the data instead. The page says which one you are reading. Each run spends under 2 USD on AI, logged in the JSON.
Charts and numbers are CC BY 4.0: reuse them freely with the credit "Kolaboro, kolaboro.com". Questions: [email protected]. Method details: delivery-delay index, asking-price index.